Numerous additional sites have been deployed in support of the IGS Annotation Engine project.
Screencasts
Screenshots
The following screenshots illustrate some of the displays and web pages available to a user who wishes to
interactively explore one or more comparative datasets using the Sybil web interface.
Interactive graphical displays
The following displays make extensive use of simple 2D graphics to convey
information from a single chado comparative database. Almost all of these graphical
displays are clickable, allowing the user to navigate between them using only
the mouse. Some of the displays provide links to download the graphical elements in PDF or SVG format.
This display provides a simple overview of the selected genome annotations along with the location or density graph of any additional feature types loaded such as repeats, SNPs,
PMARKs etc. This view supports display of %GC as well as GC-skew plots. Clicking on a region of the genome will generate a popup box that contains pertinent
information and links to other displays. This view is still under active development.
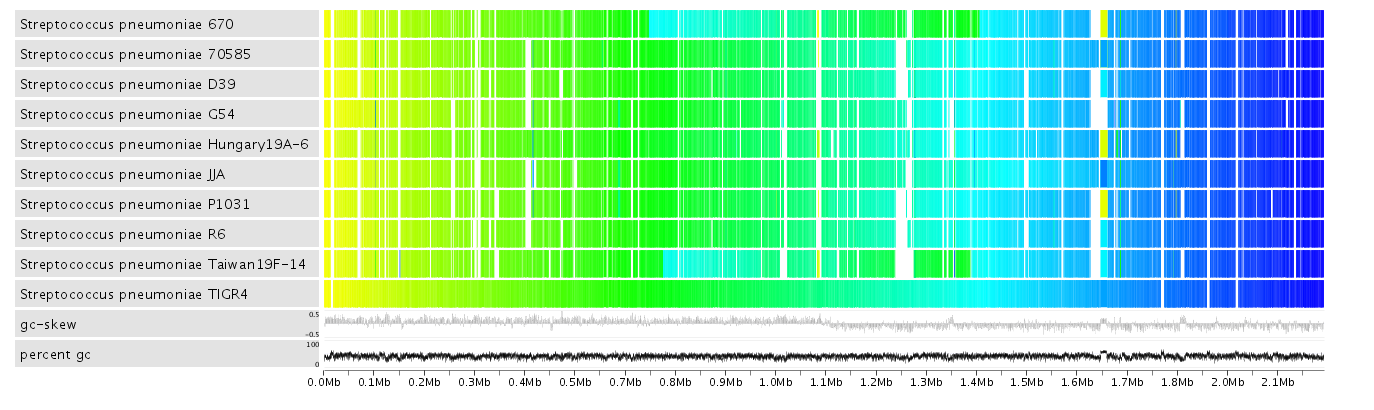
This display shows synteny between the selected genomes based on a chosen reference. The genes in the reference are colored from yellow to blue from left to right.
The matching genes (based on ortholog clustering) in the query genomes are positioned overtop of the reference gene they hit and are colored based on where they are
located in their respective genomes. This display can show where a set of genomes share conserved gene order (synteny) as well as where they diverge. It can highlight rearrangement
events strain/species specific regions. Clicking on a gene in the reference provides a popup that contains pertinent information and links to other displays. This view is still under
active development.
This page provides details about a particular gene cluster (orthologous or paralogous). At the top of the page are some
statistics about the cluster including the average percent identity and coverage of the BLAST hits that went in to generating
it. Below the statistics is a list of the genes/proteins that have been grouped together by the cluster
The next item on the page is a graphical display of the genes whose protein products have been clustered; these
"clustered" genes appear in the center of the image and are connected by regions shaded in red/pink. Nearby
genes on each of the genomic sequences are also shown, and those that were also clustered together (by the
same clustering analysis) are connected by regions that are shaded in grey.
Clicking on any gene displays a popup with pertinent information and links to other sybil pages related to that gene.
Clicking on any of the red or grey shaded regions will display a popup showing the members of that protein cluster
in addition to a link to that protein cluster page. The image can be output as an SVG.
Below the context image are pictorial representations of the best BLAST hits for all the cluster members selected at the top of the page.
This image shows the alignments of each of the best hits and provides links to their respective protein report pages.
At the bottom of this page is a multiple sequence alignment that can be rerun to reflect the cluster members selected in the list. This
alignment can be requested for either the polypeptide or transcript DNA.
This view resembles the protein cluster report page above but is more flexible. On this page you chose a reference sequence region an then several target genomes.
The regions of target genome that share above a certain number of clusters with the reference will be drawn above the reference and grey links will be drawn
between matching genes. Like the protein cluster page, the genes and cluster links are clickable. Clicking one of these features generates a popup with information
about the feature clicked as well as links to other Sybil page.
questions/comments: sybil-info last updated Oct. 5, 2012
 This display provides a simple overview of the selected genome annotations along with the location or density graph of any additional feature types loaded such as repeats, SNPs,
PMARKs etc. This view supports display of %GC as well as GC-skew plots. Clicking on a region of the genome will generate a popup box that contains pertinent
information and links to other displays. This view is still under active development.
This display provides a simple overview of the selected genome annotations along with the location or density graph of any additional feature types loaded such as repeats, SNPs,
PMARKs etc. This view supports display of %GC as well as GC-skew plots. Clicking on a region of the genome will generate a popup box that contains pertinent
information and links to other displays. This view is still under active development.